Requests
Find, filter and inspect every request that went through CoreValue.
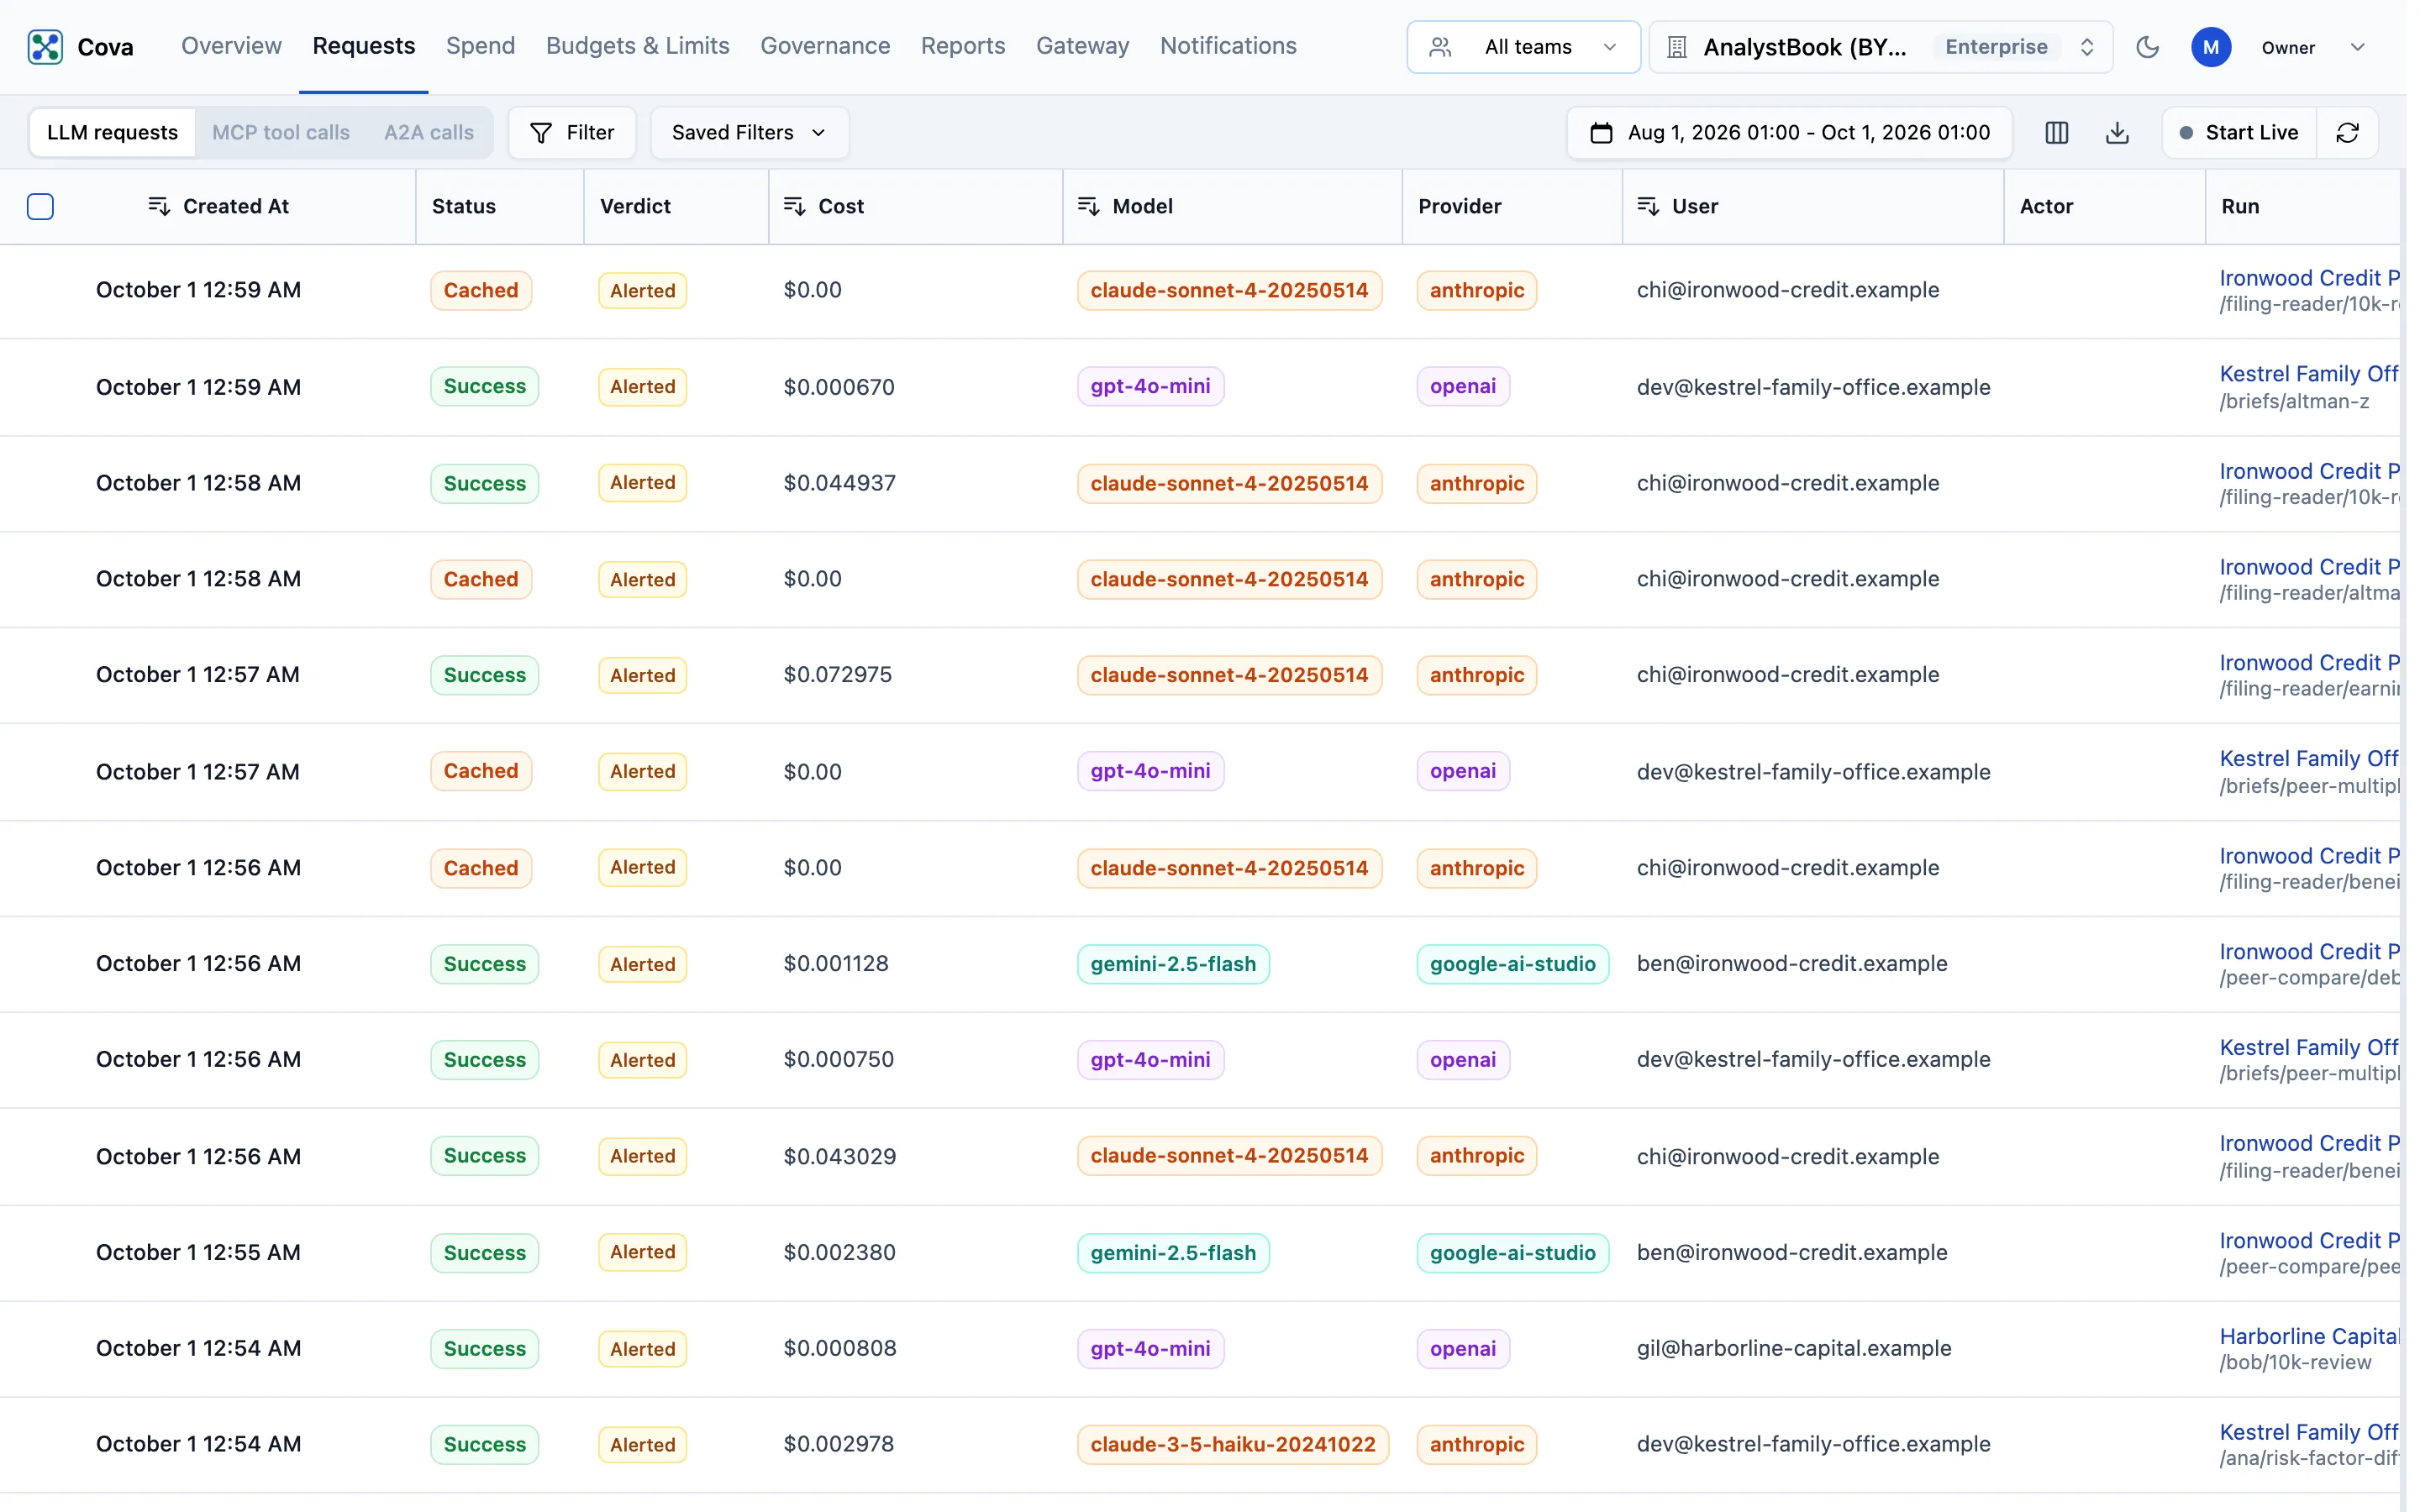
Requests is the log of every request the gateway handled, newest first. Each row says when it happened, whether it succeeded, whether a rule acted on it, what it cost and who it was for. Click a row to see the detail.
Before you start
| Requirement | Detail |
|---|---|
| Where | Top bar → Requests (/requests). |
| Role | Every role can read the log (traffic.read) and add properties, scores and feedback to a request (traffic.annotate). Saving a filter needs org.settings.write (Owner or Admin). |
| What you see | Only the requests your request visibility allows, narrowed further by the Team scope picker in the top bar. |
If your organisation also uses the MCP or agent gateway, a switch at the top of the page offers LLM requests, MCP tool calls and A2A calls. This page covers LLM requests; see Tool-call logging and cost for the others.
The columns
| Column | What it shows |
|---|---|
| Created At | When the request reached the gateway. |
| Status | Success, Cached for a response served from the cache, or the error status code. |
| Verdict | What a rule decided: Allowed, Refused, Would refuse, Downgraded, Alerted or Redacted. Hover for the rule. Empty when no rule judged the request. |
| Cost | What the request cost. Unpriced means nothing priced the model, so it was recorded at $0 and no budget saw it. declared beside a figure means it was priced at your own rate. |
| Model / Provider | The model and provider that actually served the request, after any fallback or downgrade. |
| User | The Cova-User-Id your application sent. |
| Actor | Human, Agent or Unknown. Hover to see whether it was declared with Cova-Actor or inferred. |
| Run | The run's name (or ID) with the step below it. Click to open the run. |
| Total Tokens / Latency | Tokens in and out, and the time the request took. |
| Customer / Feature | Appear when your traffic carries Cova-Customer-Id or Cova-Feature-Id. |
More columns — the token split, prompt cache tokens, and one column per property you send — are off by default. Turn them on with Manage columns (the columns icon).
Filter requests
The time range in the page header and the Team scope in the top bar apply first. For anything else:
Open the filter
Click Filter, then Add Condition.
Choose a field and a value
Pick a field — for example Model, Provider, Status Code, Verdict, Rule action, Cost, Latency (ms), User ID, Cached, Actor, Run ID, or any property you send, such as Cova-Customer-Id. Then pick an operator and a value. Add more conditions and set Match to All or Any.
Click a column header such as Cost or Latency to sort by it. Copy cURL in the filter copies the same query as an API call.
Inspect a request
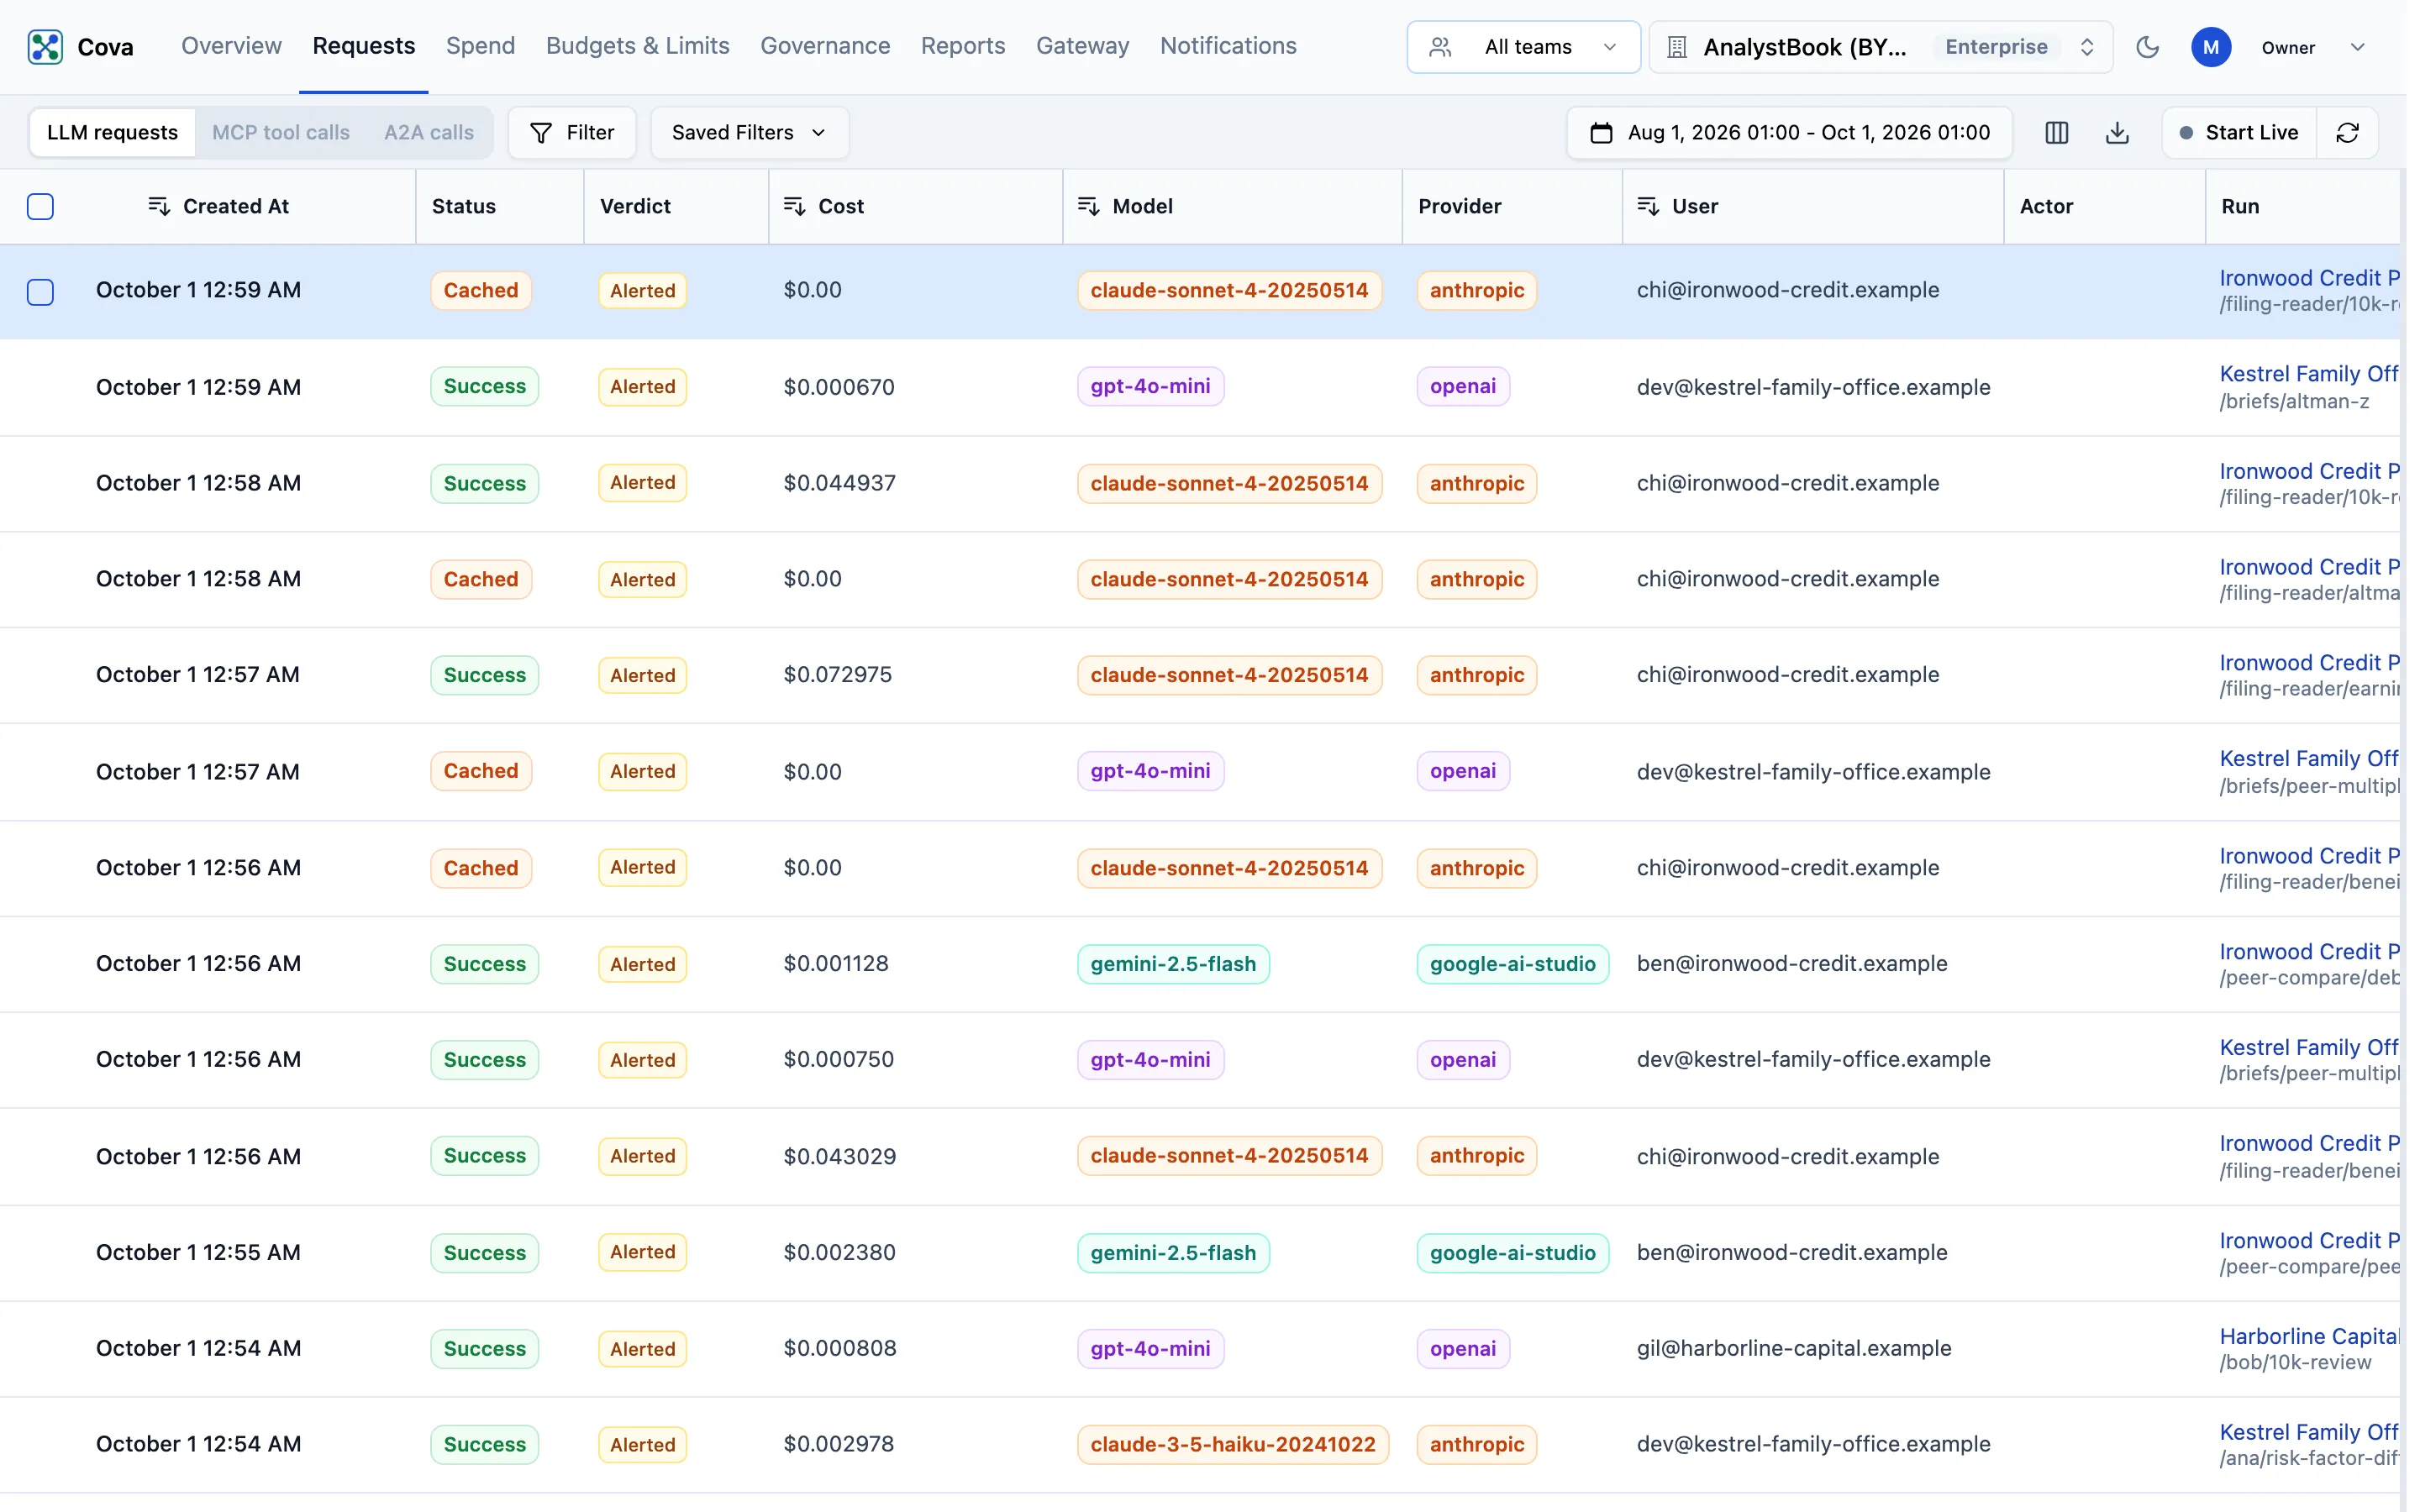
Click a row to open the request beside the table.
- The header shows the model, the latency, the cost and the status. Hover the cost to see where the price came from.
- The line below it shows the user, the run and the prompt ID, when the request carried them. Click the run to open it.
- Show Details (the chevron) adds the Provider, Created At, Request ID, User, Target URL and the token counts.
- Verdict appears when a rule acted, with the Rule, what it Applies to, the Action and the Rule id.
- Properties lists every tag on the request, including
Cova-Customer-Id,Cova-Feature-IdandCova-Team-Id. Scores and feedback can be added here. - Copy share link copies a link that opens this request.
Use the up and down arrow keys to move between requests, and Esc to close the panel.
Export
Click Export data (the download icon), choose CSV or JSONL, and click Export. It exports the rows on the current page, or only the rows you have selected (tick a row's checkbox, or hold Shift or ⌘ and click rows).
Related
- Tag your traffic — the headers behind the User, Customer, Feature, Actor and Run columns
- Spend — the same requests, totalled by who spent
- Budgets & Limits — what budgets did, in aggregate
- How cost is calculated