Spend
See where the money goes: by team, customer, feature, end user, run, key, model, provider or property.
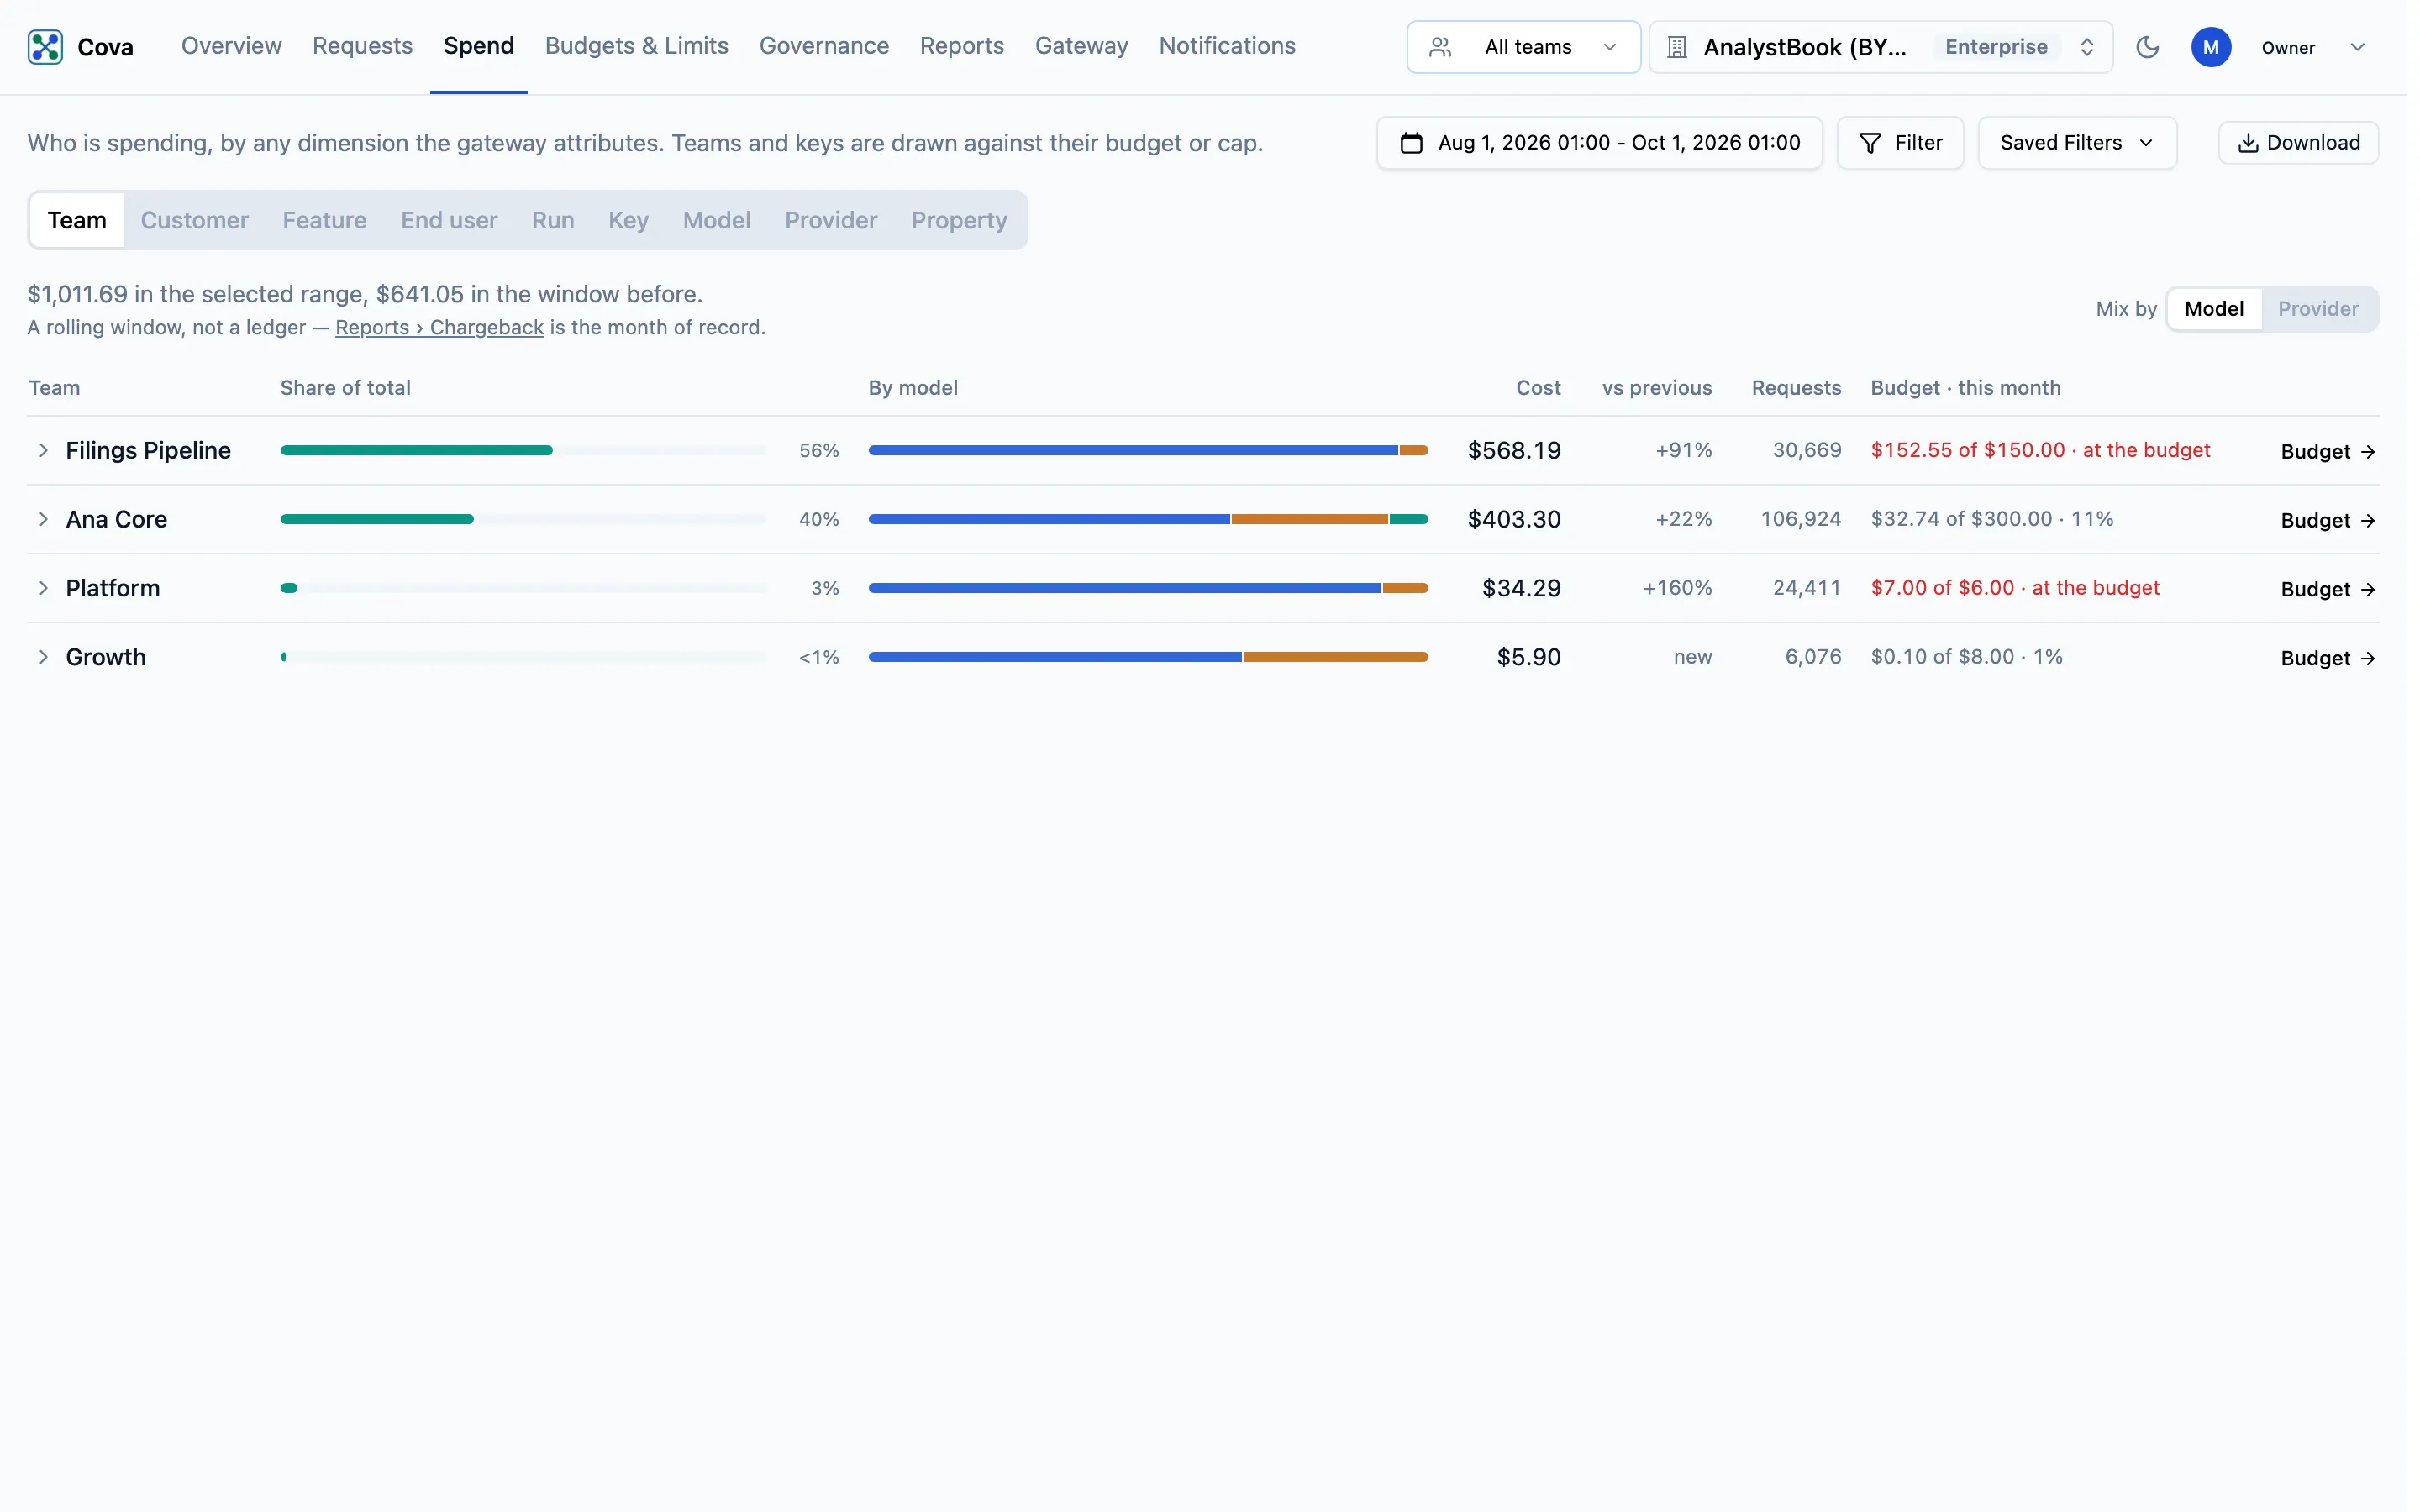
Spend totals what the gateway spent in the selected range and splits it by one dimension at a time — who spent it, what for, and on which model. Teams and keys are shown against their budget or cap.
Before you start
| Requirement | Detail |
|---|---|
| Where | Top bar → Spend (/spend). The tab is in the URL, for example /spend?by=customer. |
| Role | Every role can open it (traffic.read). |
| What you see | Only the spend your request visibility allows, narrowed by the Team scope picker in the top bar. |
Spend is a rolling window, not a ledger. For the month of record, use Reports › Chargeback.
The tabs
Each tab groups spend by one dimension. Requests that carry no value for it are grouped as Unattributed.
| Tab | Groups spend by | Filled by |
|---|---|---|
| Team | The team the key belongs to | Assigning keys to teams. Never the Cova-Team-Id header. |
| Customer | Your customer | Cova-Customer-Id. IDs are matched without regard to case, as customer budgets are. |
| Feature | The feature or surface that made the request | Cova-Feature-Id |
| End user | The person using your product | Cova-User-Id. Not a member of your organisation. |
| Run | One agent run or workflow | Cova-Session-Id, named by Cova-Session-Name |
| Key | The API key or virtual key used | Automatic |
| Agent | The agent the request's key is bound to | Automatic, once the agent is registered under Gateway › Agents and its keys are bound |
| Model / Provider | The model and provider that served the request | Automatic |
| Property | The values of one property you choose | A Cova-Property-* header. Pick it from Property under the tabs. |
How to send these headers is on Tag your traffic.
The table
Above the table, a line gives the total for the range and for the window of the same length before it.
| Column | What it shows |
|---|---|
| (dimension) | The team, customer, key or other value. Click the arrow beside it to expand the mix. |
| Share of total | Its share of the range's spend. |
| By model / By provider / By step | How its spend splits, as a bar. Choose the split with Mix by. Step is offered on the Run tab only, and splits a run by Cova-Session-Path. Not shown on the Model and Provider tabs. |
| Cost | Spend in the range. |
| vs previous | Change against the window before. new means it had no spend then. |
| Requests | Requests in the range. |
| Budget · this month / Cap · this month | Team and Key tabs only. The team's budget or the key's cap, and how much of it this calendar month has used — whatever range you picked. |
The link at the end of a row opens the team's Budget, the key's Cap, or the run itself (Open).
Rows load 100 at a time; click Load more for the next page.
Common tasks
Find your most expensive customers
- Click the Customer tab.
- Pick a range in the page header.
- Rows are sorted by cost. Click the arrow on a row to see which models its spend went to.
To cap a customer, set a customer budget.
Find the step of an agent run that cost the most
- Click the Run tab and set Mix by to Step (it opens on Step unless you picked another split earlier).
- Click the arrow on the run to list its steps, with the cost, share and requests of each.
- Click Open to follow the run request by request on Runs.
See what each agent spends
- Register each agent under Gateway › Agents (one with no endpoint is enough) and bind it to the keys it calls with.
- Click the Agent tab.
The agent is read from the key when you look, not stored on each request: binding a key attributes its earlier requests too, and moving a key to another agent moves its history with it. A request made with a proxy key counts toward the agent that key is bound to. MCP tool calls are not priced yet, so they add nothing to an agent's total.
Narrow to one slice and download it
- Click Filter and add a condition — for example Model equals
gpt-4o. The filter is the same one Requests uses. - Click Download. You get the rows shown, every column, as a CSV file.
Related
- Tag your traffic — fill the Customer, Feature, End user, Run and Property tabs
- Dashboard — the top eight of each tab, beside the rest of the picture
- Chargeback — the closed month, per team
- Unit economics — cost per customer against what you charge