Executive report
A one-page summary of AI spend and usage for leadership, ready to print or save as a PDF.
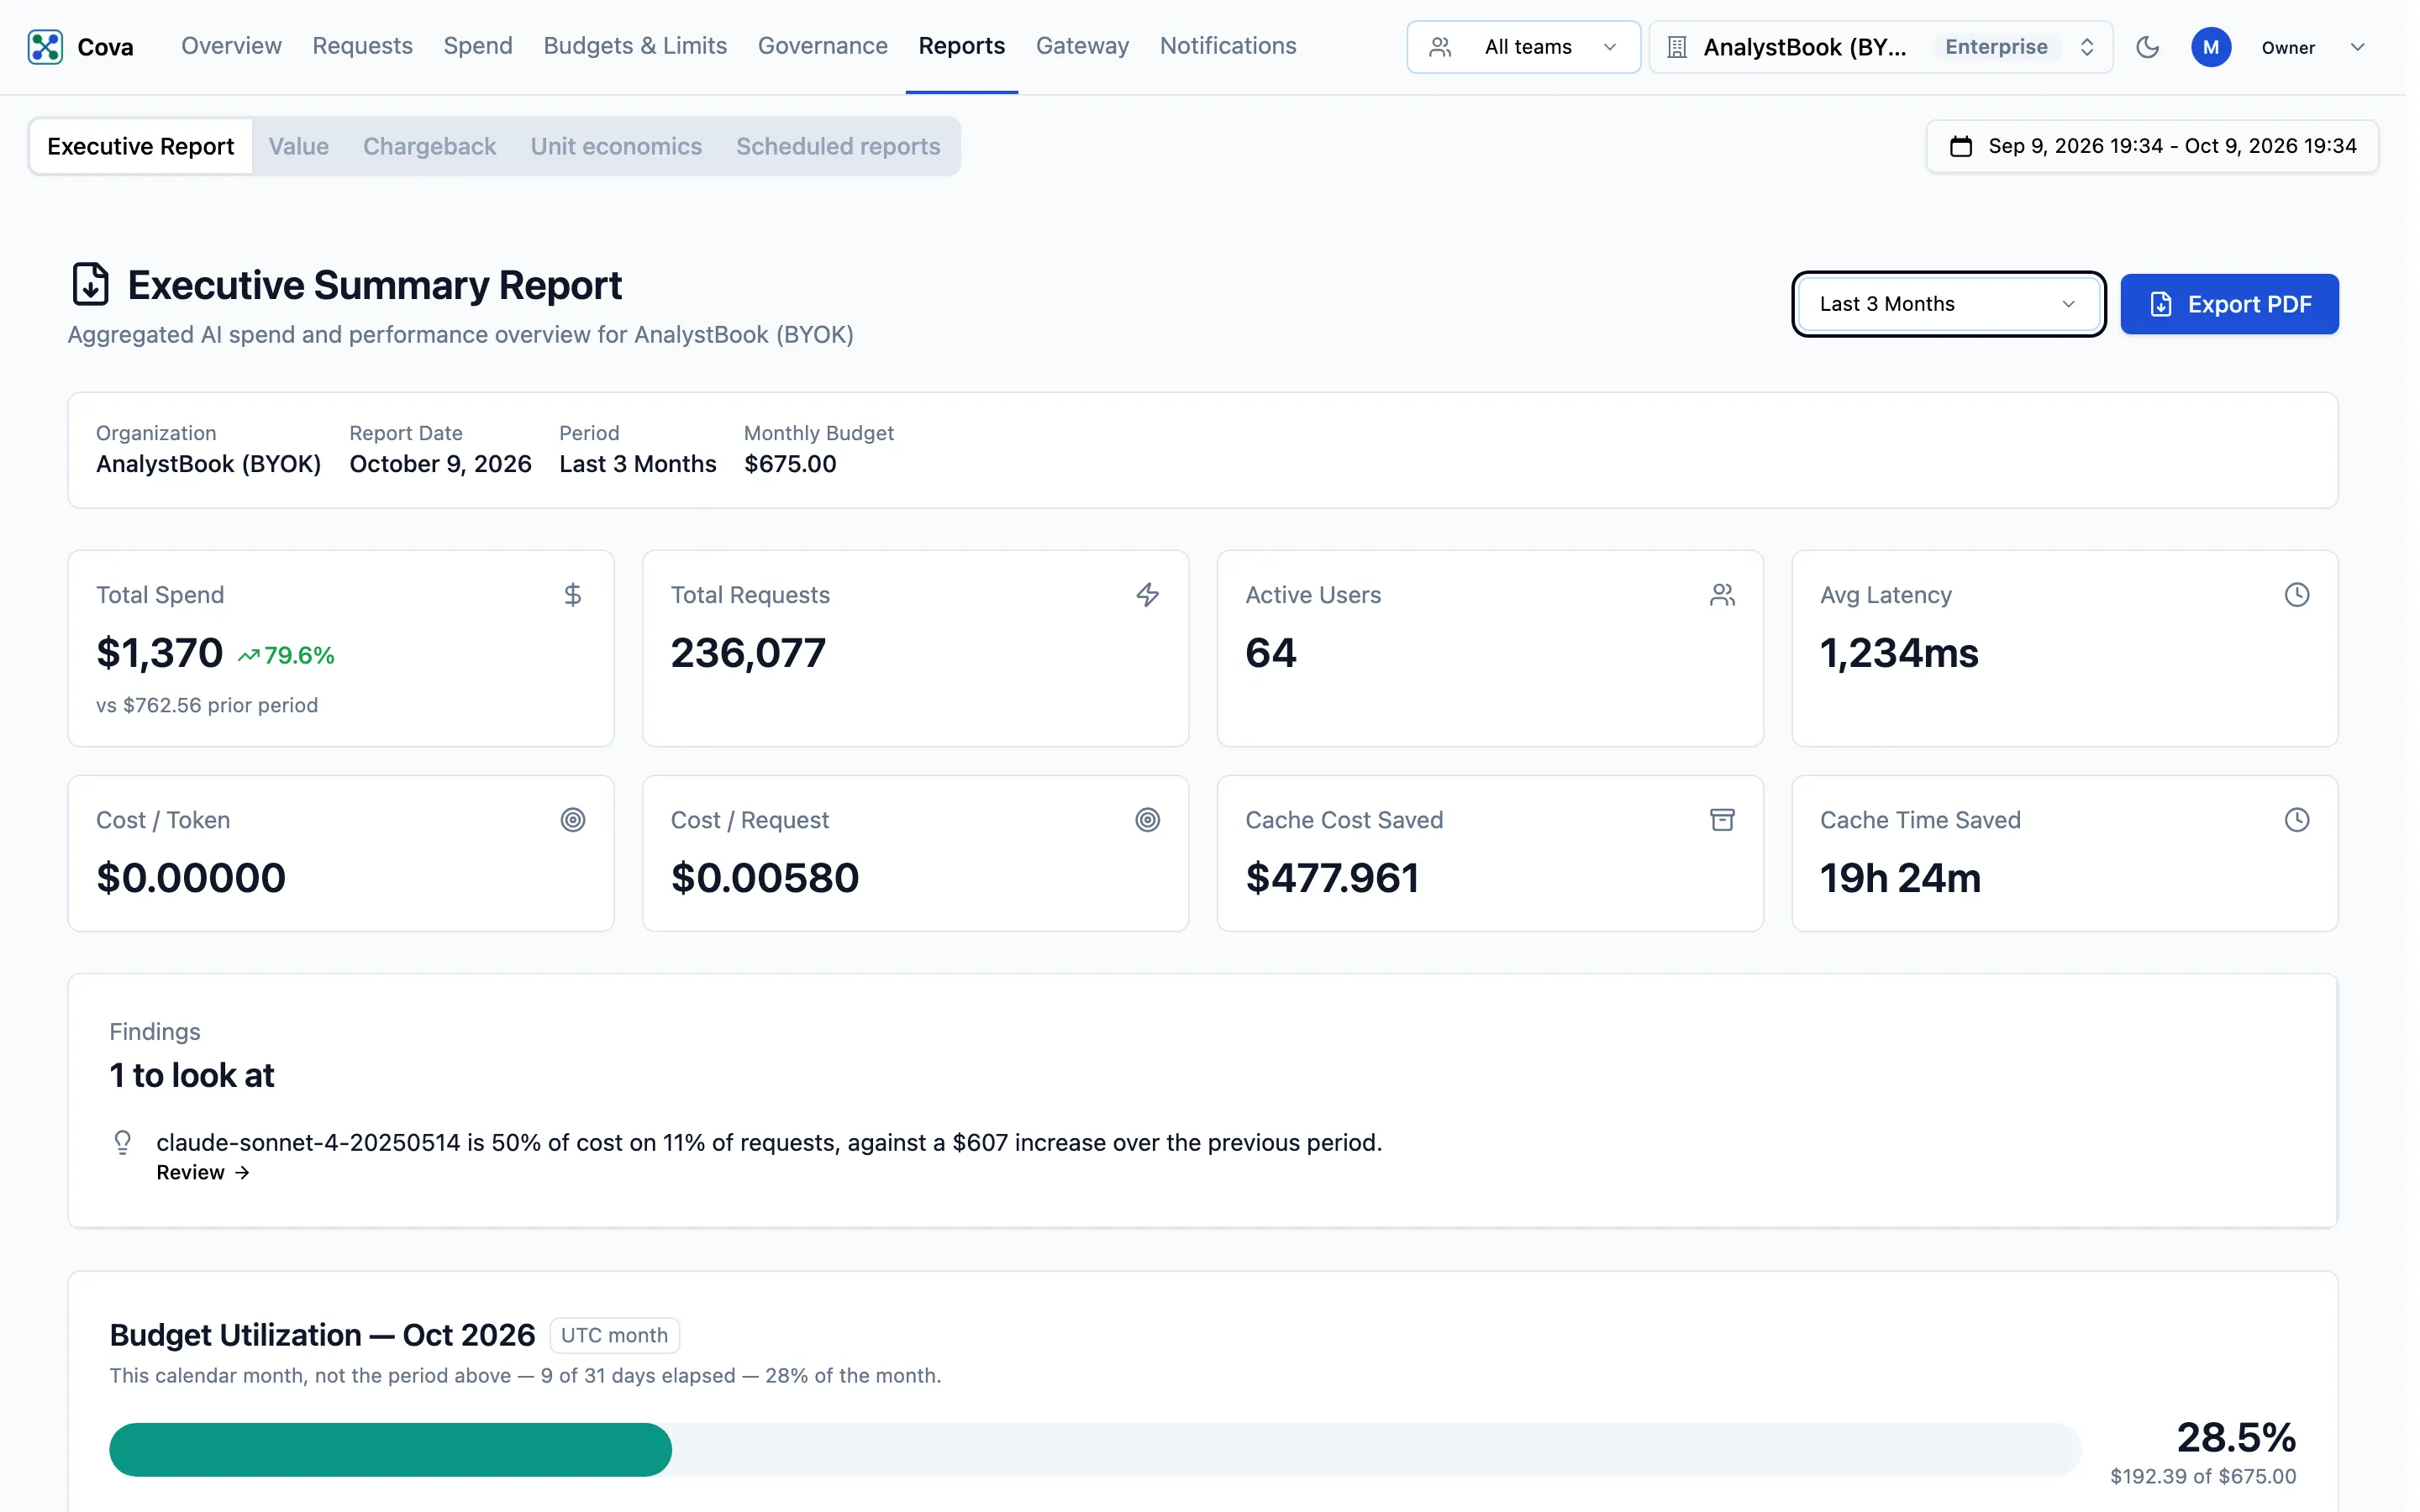
The Executive Report is the first tab of Reports. It puts the period's spend, request volume, efficiency and cache savings on one page, with this month's budget position and the five most expensive models, so you can hand leadership a summary without building one.
Before you start
| Requirement | Detail |
|---|---|
| Where | Top bar → Reports → Executive Report (/reports?tab=executive). |
| Role | Anyone who can read traffic (traffic.read) sees the figures. The Budget Utilization block also needs reports.read, which owners and admins hold; members do not see it. See Roles and permissions. |
| Plan | Every plan. |
Choose the period
Use the period menu at the top right:
| Option | Covers |
|---|---|
| Last 7 Days | The seven days up to now. |
| Last Month | One month back from today, up to now. This is the default. |
| Last 3 Months | Three months back from today, up to now. |
These are rolling windows ending now, not calendar months. Every figure on the page uses the period you choose, except Budget Utilization, which is always the current calendar month.
What the report shows
Headline figures
| Figure | What it means |
|---|---|
| Total Spend | What requests cost in the period. The arrow and percentage compare it with the period of the same length just before; the note under it gives that previous figure. |
| Total Requests | Requests made through the gateway in the period. |
| Active Users | Distinct end users (Cova-User-Id values) seen in the period. |
| Avg Latency | Average request latency, in milliseconds. |
| Cost / Token | Spend divided by tokens. |
| Cost / Request | Spend divided by requests. |
| Cache Cost Saved | What requests answered from the cache would otherwise have cost. |
| Cache Time Saved | The response time those cached answers saved. |
The two cache figures read Owners only when your organisation restricts request visibility and you are not the owner.
Finding
When spend moved against the previous period and one model makes up at least 40% of the top models' cost, a line under the figures names it, with its share of cost, its share of requests, and the change in spend. With no dominant model, no line appears.
Budget Utilization
The current UTC calendar month's spend against the organisation's Monthly Budget, as a bar and a percentage, with a note on how far through the month you are. Spend above the budget shows Over budget by the difference. The block appears only when an organisation budget is set; see Budgets & Limits.
The month's spend here is the same figure Chargeback shows, so the two pages agree.
Top 5 Models by Cost
The five models with the highest cost in the period, with their Requests, Total Tokens and Cost.
Spend Trend (Period over Period)
Current Period, Previous Period and the Change between them, with a sentence saying whether spend rose, fell or stayed flat.
Share the report
Click Export PDF. Your browser's print dialog opens on a print layout headed with your organisation's name and today's date; choose Save as PDF or a printer.
The Executive Report is a summary, not a ledger. For the figures an invoice should quote, use Chargeback. To weigh spend against what the work was worth, use Value.
Related
- Spend: the same spend broken down by team, customer, model and more
- Chargeback
- Scheduled reports