Overview
Spend, traffic, budgets and errors for the selected range, on one page.
The Dashboard is the console's Overview page. It answers three questions for the range you pick: how much did we spend, where did it go, and did anything go wrong. Each panel links to the page where you can dig in or act.
Before you start
| Requirement | Detail |
|---|---|
| Where | Top bar → Overview (/dashboard). |
| Role | Every role can open it (traffic.read). Owners and admins also see the links that change settings, such as Set a budget. |
| What you see | Only the traffic your request visibility allows. A member on no team, under team visibility, sees "You aren't on a team yet" instead of data. |
Controls
The controls sit in the bar at the top of the page. The range and the filter are shared with Requests and Spend, so a view you set up on one page follows you to the others.
| Control | What it does |
|---|---|
| Date range | The window every panel uses, except Budget health and Projected Month-End, which always cover this month. |
| Filter | Narrows the panels to the requests that match, for example one model or one customer. See Filter requests. |
| Team scope (top bar) | All teams, one team, or No team (keys not assigned to a team). The team is the one the key belongs to, never a header your application sends. |
| Export dashboard (download icon) | Downloads the dashboard's data for the range as an Excel file. |
| Start Live | Refreshes the panels as new requests arrive. Click it again to stop. |
The panels
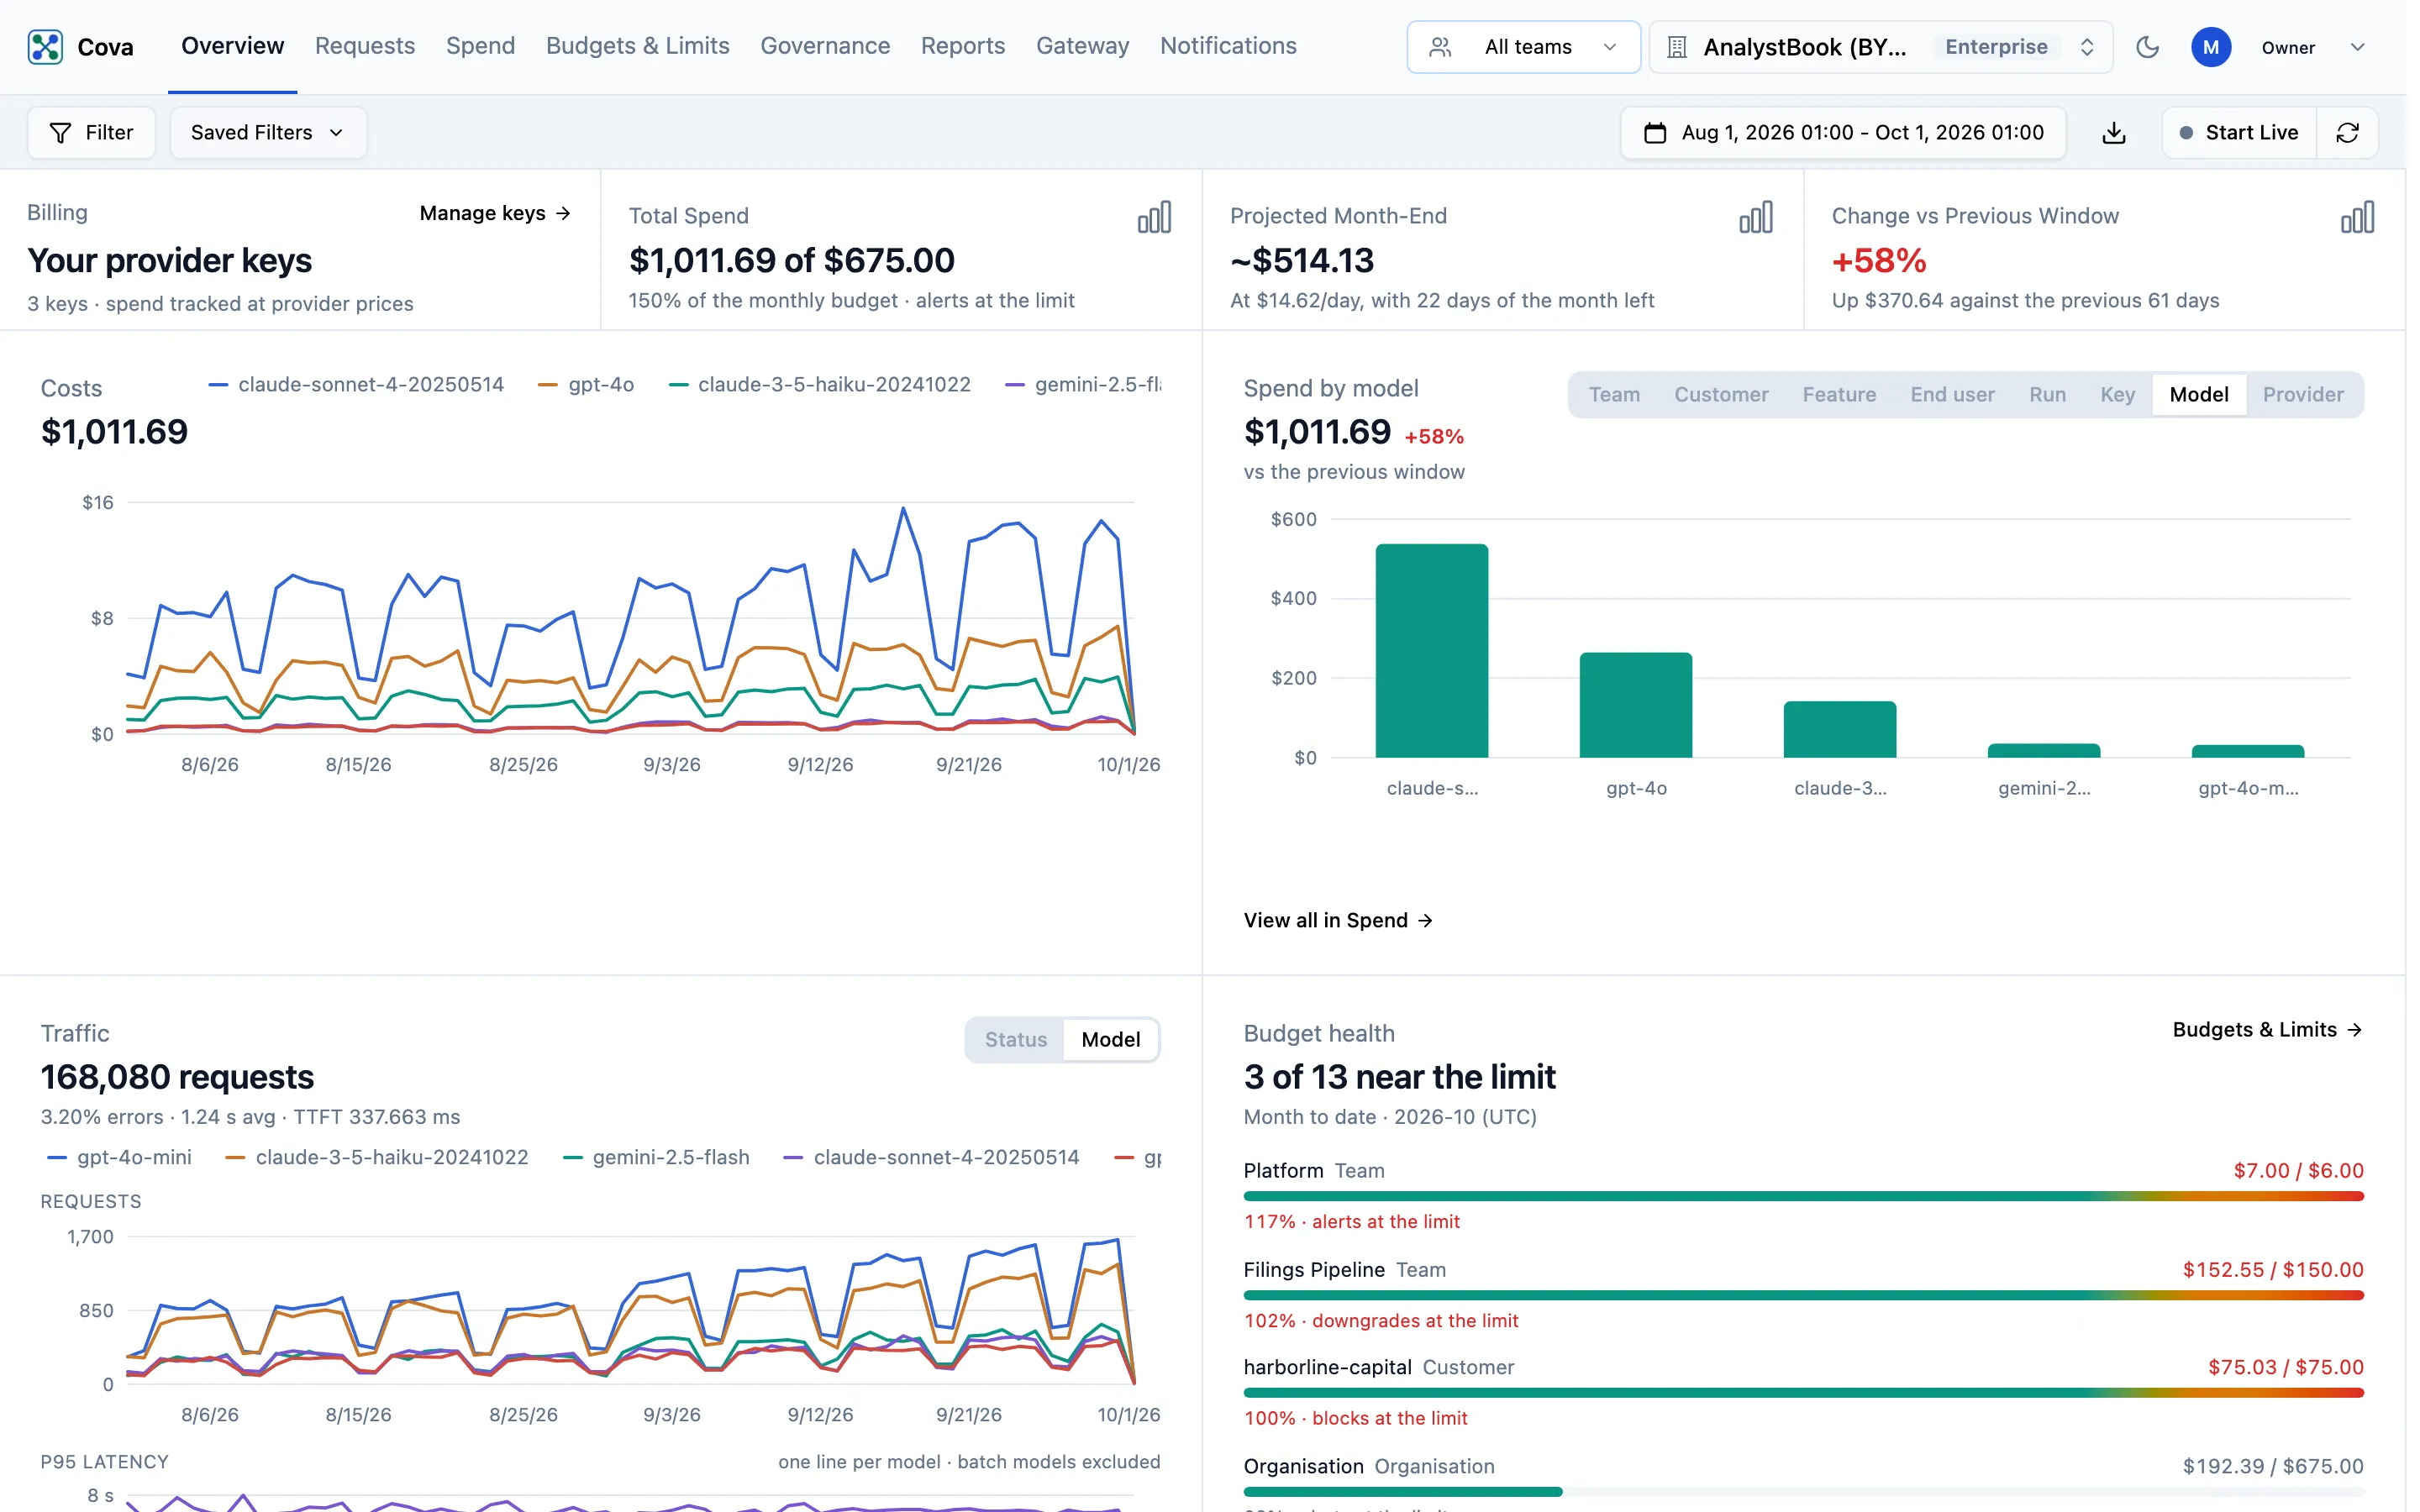
| Panel | What it shows |
|---|---|
| Billing | How your requests are paid for — for example Your provider keys with the number of keys, or Plan usage with the requests used against your plan's limit. |
| Total Spend | Spend in the range. With a monthly budget set it reads "$X of $Y", with the share of the monthly budget used and what happens at the limit. Without one, it shows the request count and the average cost per request. |
| Projected Month-End | What the calendar month will close at if the recent daily rate holds, and the date the budget runs out if it will. On plans without forecasting it reads "On paid plans". |
| Change vs Previous Window | Spend against the window of the same length just before it, as a percentage and in dollars. |
| Costs | Spend over time, stacked by model. |
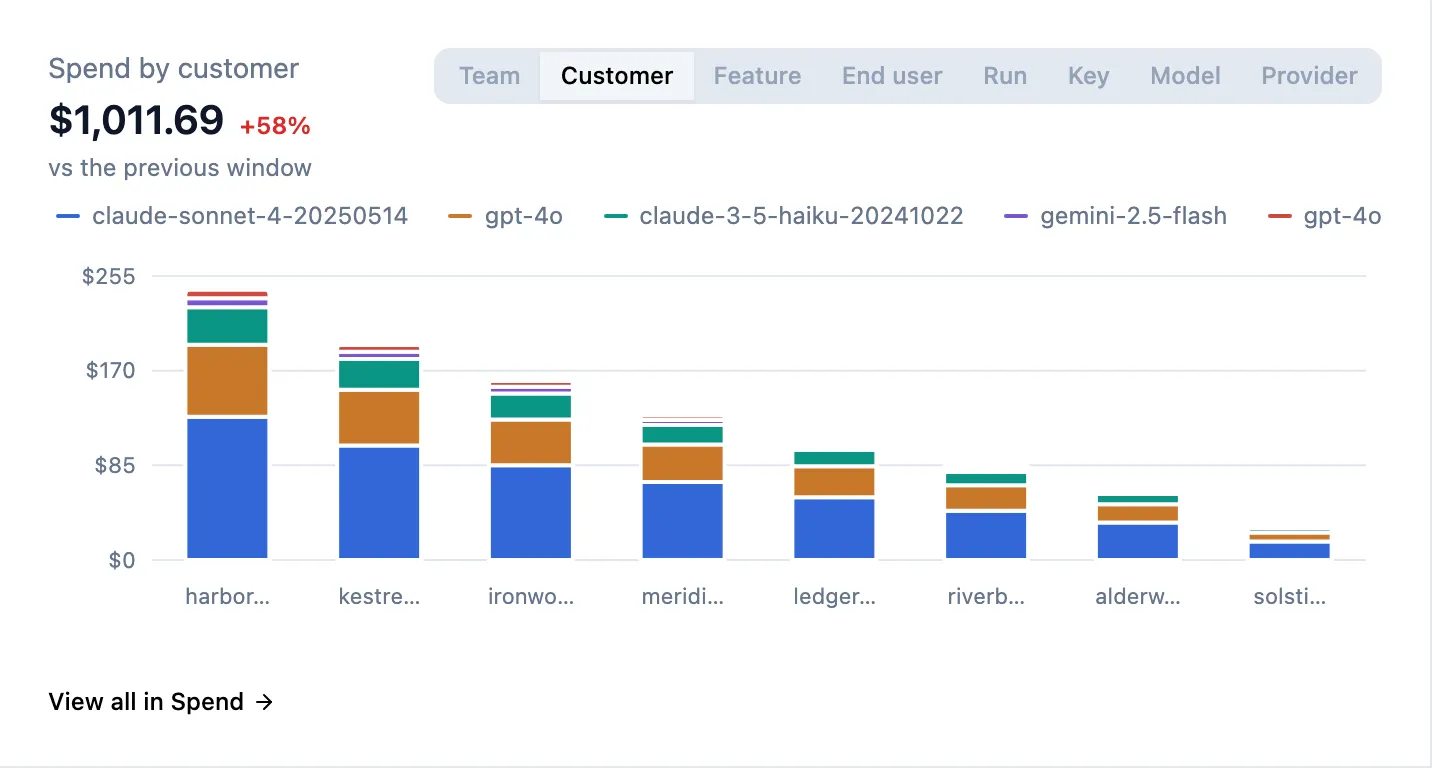
| Spend by … | The top eight by Team, Customer, Feature, End user, Run, Key, Model or Provider, each with its change against the previous window. |
| Traffic | Total requests, error rate and average latency. The chart stacks requests by Status or Model, with P95 latency below it. |
| Budget health | Every organisation, team and customer budget, month to date, nearest its limit first. |
| All Errors | Failed requests, as a count and a share of all requests, broken down by status code. |
| Findings | Things that need a decision: key caps or team budgets that add up to more than the organisation budget, plan usage nearing its limit, budgets that acted in the range, and suggestions to move a model's traffic to a cheaper one. |
| Governance | How many requests a rule acted on in the range, one line per kind of rule — budgets, key caps, rate limits, key scopes, the PII policy and the rest. Each line links to where the rule is set. |
Under a team scope, Total Spend is measured against that team's own budget when it has one.
Common tasks
Find what caused a spike
- Click the bar for the spike in Costs or Traffic. Requests opens on exactly that time slice.
- Sort by Cost, or use Filter to narrow to one model or customer.
See who is spending
- In Spend by …, pick a tab, for example Customer.
- Click View all in Spend for the full list. On the Team and Key tabs, Team budgets and Key caps open the limits for each one.
Check your budgets
Budget health lists every budget with its spend this month. If none is set, owners and admins see Set a budget. Budgets are set on Budgets & Limits.
Customer rows in Budget health and budget actions in Findings need the reports.read permission. Without it, the panels say those rows are hidden rather than showing them as empty. See Roles and permissions.
Related
- Spend — every dimension, the whole list
- Requests — the request log behind every figure
- Tag your traffic — fill the Customer, Feature, End user and Run tabs
- Budgets & Limits — set the budgets this page measures against