Runs
Follow a multi-step agent run from its first request to its last.
A run is the set of requests one agent loop, workflow or user task made. Tag each of those requests with the same run ID, and the console shows them together: what the run cost in total, which step cost the most, and the order the requests happened in.
Tag a run
Send these headers on every request that belongs to the run:
| Header | What it does | Example |
|---|---|---|
Cova-Session-Id | Required. Identifies the run. Use a new value for each run. | run_7f3a |
Cova-Session-Name | Names it. Many runs can share a name — it is what the agent or workflow is called. | Code review |
Cova-Session-Path | Places the request in the run's tree. /plan/search sits under /plan. A request without a path sits at /. | /plan/search |
curl https://gateway.corevalue.dev/v1/chat/completions \
  -H "Authorization: Bearer $COVA_API_KEY" \
  -H "Content-Type: application/json" \
  -H "Cova-Session-Id: run_7f3a" \
  -H "Cova-Session-Name: Code review" \
  -H "Cova-Session-Path: /plan/search" \
  -d '{"model": "gpt-4o-mini", "messages": [{"role": "user", "content": "Hello"}]}'
Values are trimmed and cut at 256 characters; blank values are ignored. See Headers.
Find a run
There is no list of runs on its own. You open a run from where you notice it:
- Spend → Run tab: runs ranked by cost. Click Open on a row. See Spend.
- Requests → the Run column: click the run's name. See Requests.
- A request's detail: click the run under the model name.
When you open a run from one of these, Back to Spend (or Requests, or Overview) at the top returns you to where you were, filters included.
The run page
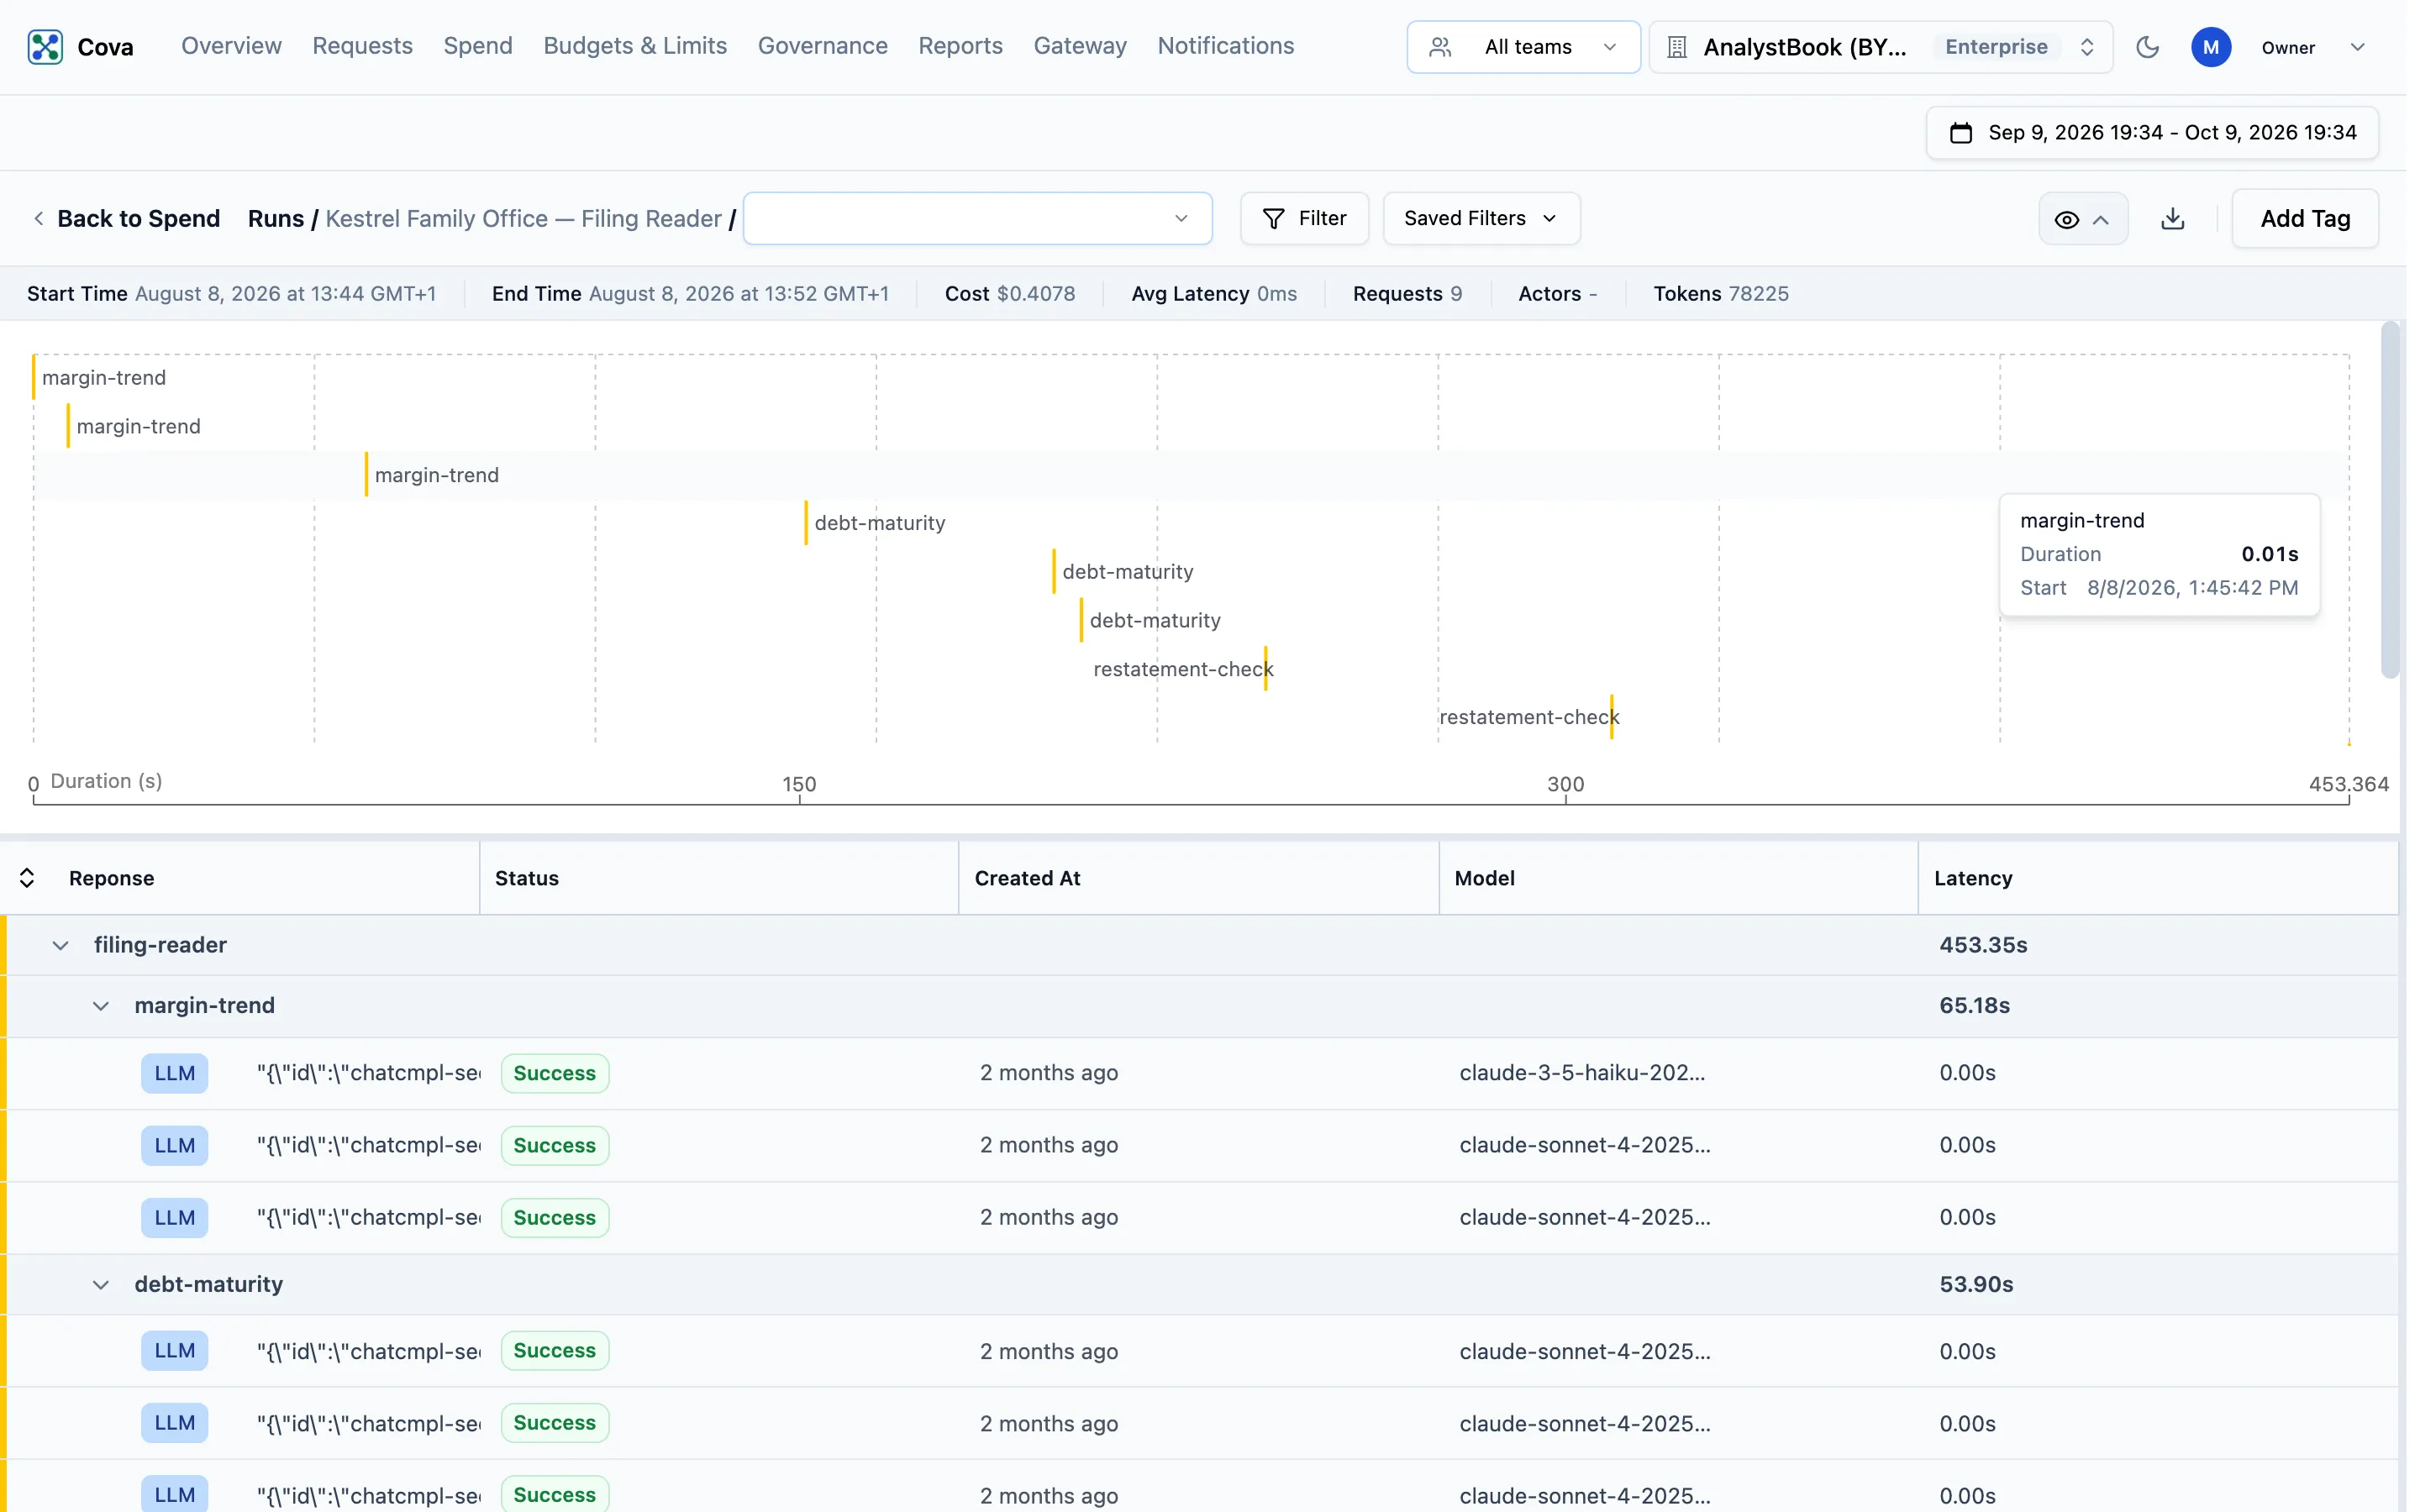
| Part | What it shows |
|---|---|
| Breadcrumb | Runs / the run's name / a menu of run IDs that share the name, to switch to another run of the same agent. |
| Summary | Start Time, End Time, Cost, Avg Latency, Requests, Actors (how many turns were human, agent or unknown) and Tokens. |
| Timeline | One bar per request, by path, against time in seconds. Long bars are slow requests. |
| Steps table | Every request in the run as a tree by path, with Status, Created At, Model, Cost, Latency and Feedback. Expand a path to see the requests under it. |
| Request detail | Click a bar or a row to open that request beside the run, as on Requests. |
The page header also has Filter, Export raw data (download icon) and Add Tag, which labels the run (traffic.annotate).
Requests are listed oldest first, 500 to a page by default. The run page reads the last three months of traffic.
Common tasks
Find the step that made a run expensive
- On Spend, click the Run tab and set Mix by to Step.
- Click the arrow on the run to see the cost of each step.
- Click Open, then click that step in the steps table to see its requests.
Find the slow request
Open the run and look at the Timeline. Click the longest bar to open that request, and check its Latency, Model and Status.
Who can see runs
Runs follow the same rules as Requests: every role can open them (traffic.read), and you see only the requests your request visibility allows.
Related
- Tag your traffic — every header CoreValue records
- Spend — the Run tab
- Requests — the Run column and filters